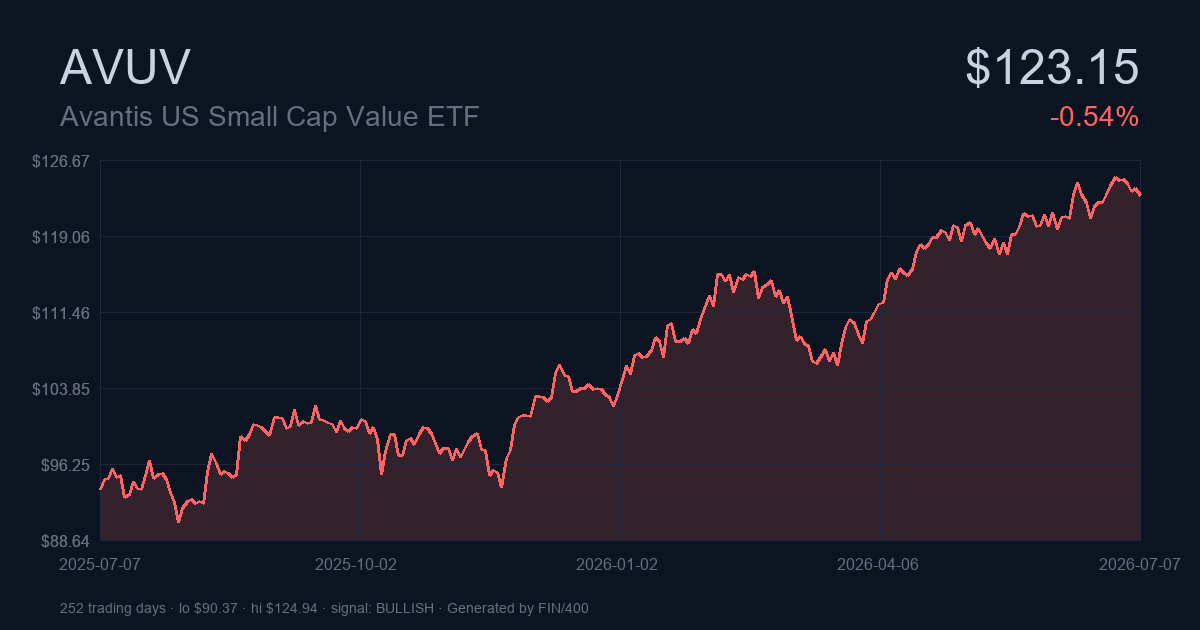
Deep-dive research on Avantis US Small Cap Value ETF (AVUV) — published 2026-07-07 18:26 UTC, current price $123.15.
AVUV sits at $123.15, in the top 15% of its 52-week range ($89.27 to $125.69). Prices this close to the high tell you the trend has recently been strong; the question this analysis works to answer is whether that strength is likely to continue.
Where I Land
Based on a comprehensive review of 11 technical indicators, historical price action, and risk-adjusted return characteristics, our current outlook on AVUV is:
- Near-term view (0-3mo): AVOID — moderate conviction
- Multi-year view (12mo+): BUY — strong conviction
- Composite reading: Bullish — strong strength
At the current price of $123.15 (day change: -0.54% ▼), AVUV sits at 93% of its 52-week range ($89.27 – $125.69). Full analysis follows.
Fast Read
What jumps out looking at AVUV’s trailing data and current indicator readings:
- Trailing 1-year: AVUV has gained 29.62%, outpacing the long-run US equity average of roughly +10%.
- Volatility: 22.62% annualized is elevated. Sharpe 0.29, Sortino 0.30.
- Historical drawdown: worst peak-to-trough in the sample was -29.36%, bottomed on 2025-04-08.
- Technical composite: score +0.60 on -1/+1 scale — 4 bullish indicators vs 1 bearish.
- Verdicts: short-term AVOID (moderate conviction), long-term BUY (strong conviction).
A Quick Primer on AVUV
Meet AVUV: Avantis US Small Cap Value ETF, an Exchange-Traded Fund (ETF) focused on small-capitalization US equities, trading on PCX in USD. The technical, return, and risk analysis below draws entirely from the public trailing history for this ticker.
Key Facts
| Attribute | Value |
|---|---|
| Symbol | AVUV |
| Full name | Avantis US Small Cap Value ETF |
| Exchange | PCX |
| Currency | USD |
| Type | etf |
| 52-week high | $125.69 |
| 52-week low | $89.27 |
| Position in 52w range | 93% |
AVUV’s Recent Performance
Over the trailing year, AVUV delivered exceptional returns of +29.62%, well above the historical average for broad US equity indices (roughly +10% annualized). Recent three months for AVUV: +9.80%. Momentum is accelerating rather than fading. YTD stands at +19.42% for AVUV — the reference number most holders actually track relative to their expectations at the start of the year.
Rolling Return Windows
Reading down the table: how AVUV has performed across each standard trailing window, on a total-return basis (dividends reinvested via Yahoo’s adjusted closes).
| Time window | Total return | Starting price |
|---|---|---|
| 1 Day | -0.54% | $123.82 |
| 1 Week | -1.20% | $124.65 |
| 1 Month | +1.40% | $121.45 |
| 3 Month | +9.80% | $112.16 |
| 6 Month | +19.42% | $103.12 |
| Year-to-Date | +19.42% | $103.12 |
| 1 Year | +29.62% | $95.01 |
| Full sample (5.0y) | +68.77% (CAGR +11.09%) | $72.97 |
Volatility, Drawdowns, and Risk-Adjusted Returns
At 22.62%, AVUV’s volatility is elevated versus a broad index. This is the range typical for small-cap or single-sector concentrated positions. Sharpe at 0.29 tells a mediocre risk-adjusted story — investors who wanted returns have gotten some, but they paid a lot of volatility to get it. Sortino 0.30. Max drawdown was -29.36% (low: 2025-04-08) — the worst-case realized experience in the sample. Sizing that permits sitting through a repeat is the right frame.
Risk metrics computed over trailing ~5.0 years of daily closes.
| Risk metric | Value | What it measures |
|---|---|---|
| Annualized return (CAGR) | 11.09% | Compound growth rate — geometric mean annualized |
| Annualized volatility | 22.62% | Standard deviation of returns, scaled to one year |
| Downside deviation | 22.14% | Volatility of negative returns only |
| Sharpe ratio | 0.29 | Excess return per unit of total volatility (vs 4.5% Rf) |
| Sortino ratio | 0.30 | Excess return per unit of downside volatility |
| Max drawdown | -29.36% | Largest peak-to-trough decline (bottomed 2025-04-08) |
The Trailing-Year Chart
$ 124.76 |                                                           *
         |                                                  *     ***
         |                                               *** *****
         |                                    **        *
         |                                   *  **     *
         |                                ** |    *  * |
$ 108.52 |                               *  *      ** *
         |                         ******
         |         *******   *    *
         |         |      *** *** |
         | ****  **              *
$  92.28 |*    **
         +------------------------------------------------------------
          2025-07-07               2026-01-05               2026-06-30
Reading the chart: start at $93.69 on 2025-07-07, end at $123.15 on 2026-07-07. That’s +31.44% net across 1 year of daily bars. The peak of the visible window sits recently at $124.94 (2026-06-26) — a bullish structural detail worth pairing with the momentum readings below.
Recent 30-Day Action
$ 124.94 |                       ***
         |              *       *   * *
         |             * *     *     * *
         |             |  *  **
$ 122.32 |             |   |*
         | ***  * * ***    ||
         | |  | |||||      *
$ 119.70 |*   ** * *
         +------------------------------
          2026-05-22 2026-06-15 2026-07-07
The 30-day chart offers a tighter view of recent price action — useful for identifying short-term support, resistance, and potential entry zones for tactical positions.
Technical Analysis Deep Dive
Technical readings aren’t fortune-telling — they’re a compressed summary of what supply and demand have already done. The following section reads each signal for AVUV and combines them into a composite view.
The Aggregate: 🟢 Bullish — Strong
Vote count across all 11 tracked indicators: bullish 4, bearish 1, neutral 6. The signed composite comes out to +0.60 (bounds are -1 to +1). No weighting is applied — each indicator gets one vote.
This translates to a Strong bullish overall verdict. Multiple independent signals — spanning momentum, trend, and volume categories — are aligned to the upside. Broad agreement across indicator families is historically associated with better-than-average forward returns, though it never guarantees them.
Signal Breakdown by Indicator
The following table summarizes the current reading of each individual indicator. Detailed interpretation follows for the readings that are unusual enough to warrant explanation.
| Indicator | Signal | Interpretation |
|---|---|---|
| RSI-14 | 🟡 NEUTRAL | RSI 54 in neutral zone |
| MACD | 🔴 BEARISH | MACD Bearish (above zero) |
| MA-50 | 🟢 BULLISH | Price above MA50 ($120.92) |
| MA-200 | 🟢 BULLISH | Price above MA200 ($109.57) |
| MA-50/200 cross | 🟢 BULLISH | Golden Cross (MA50 > MA200) |
| Bollinger Bands | 🟡 NEUTRAL | Mid-band (pos 53%) |
| Volume | 🟡 NEUTRAL | Volume normal (0.95× avg) |
| ADX | 🟡 NEUTRAL | ADX 8 (weak trend, ranging) |
| Stochastic | 🟡 NEUTRAL | Stochastic 52 |
| OBV | 🟢 BULLISH | OBV rising (accumulation) |
| ATR | 🟡 NEUTRAL | ATR $1.64 (1.3%) — normal |
Zooming In on the Non-Neutral Signals
Skipping the neutral readings for space — here are only the AVUV indicators that are currently producing a directional signal worth thinking through.
MACD
MACD reading: BEARISH — MACD Bearish (above zero). A trend-confirmation indicator; useful mainly when it agrees with price action rather than trying to lead it.
MA-50
50-day MA read: BULLISH — Price above MA50 ($120.92). For AVUV, this is the dividing line between an intact medium-term trend and one that has just cracked.
MA-200
Price vs MA-200: BULLISH — Price above MA200 ($109.57). The most-watched long-term trend indicator; institutional trend-followers use it as an on/off exposure switch.
MA-50/200 cross
MA-50/200 cross: BULLISH — Golden Cross (MA50 > MA200). Golden crosses and death crosses have poor short-term reliability but decent multi-month reliability. Where AVUV sits on this metric shapes multi-month positioning.
OBV
On-Balance Volume: BULLISH — OBV rising (accumulation). When OBV disagrees with price, price usually catches up eventually.
Trading Thesis for AVUV
The following thesis distinguishes between two independent time horizons: short-term (0-3 months) and long-term (12+ months). These horizons draw on different subsets of the indicators above.
Short Horizon (0-3mo): 🔴 AVOID — Moderate
Short-term momentum is soft. New long positions carry elevated risk of immediate drawdown. Wait for a clearer reversal signal (e.g. RSI < 30 or bullish MACD cross).
The specific readings behind the avoid call:
- RSI-14 at 53.9 — dead center. No directional edge from momentum alone right now.
- MACD reading: BEARISH — MACD Bearish (above zero). A trend-confirmation indicator; useful mainly when it agrees with price action rather than trying to lead it.
Long-Term Outlook (12+ Months): 🟢 BUY (Strong Conviction)
Long-term structure is unambiguously bullish. Trend, trend strength, and volume flows are all aligned for a durable multi-quarter advance. Suitable for a core position with room to add on pullbacks.
What’s driving the buy take:
- Price is above the 50-day moving average — Price above MA50 ($120.92).
- Price is above the 200-day moving average — Price above MA200 ($109.57).
- 50-day MA read: BULLISH — Price above MA50 ($120.92). For AVUV, this is the dividing line between an intact medium-term trend and one that has just cracked.
- ADX: NEUTRAL — ADX 8 (weak trend, ranging). Regime indicator: are we in a trending environment or a range?
- Volume analysis for AVUV: NEUTRAL — Volume normal (0.95× avg). The tell that separates real moves from technical drift.
- Trading at 93% of the 52-week range — extended toward highs.
Methodology in One Paragraph
Under the hood: daily adjusted closes from Yahoo Finance drive every number. Volatility is the standard-deviation of daily log-returns annualized to 252 trading days. Sharpe and Sortino use 4.5% Rf. The composite signal counts bullish minus bearish votes from 11 individual indicator rules.
Disclaimer
Nothing here constitutes personalized financial advice. It’s a rules-based technical read, published for education and discussion. Past performance doesn’t guarantee anything; indicators can and do fail. Talk to a licensed advisor before making trades based on this analysis.
Report generated by FIN/400 on 2026-07-07 18:26 UTC. Data via Yahoo Finance. Snapshot as of the generation timestamp; markets move continuously.
Leave a Reply