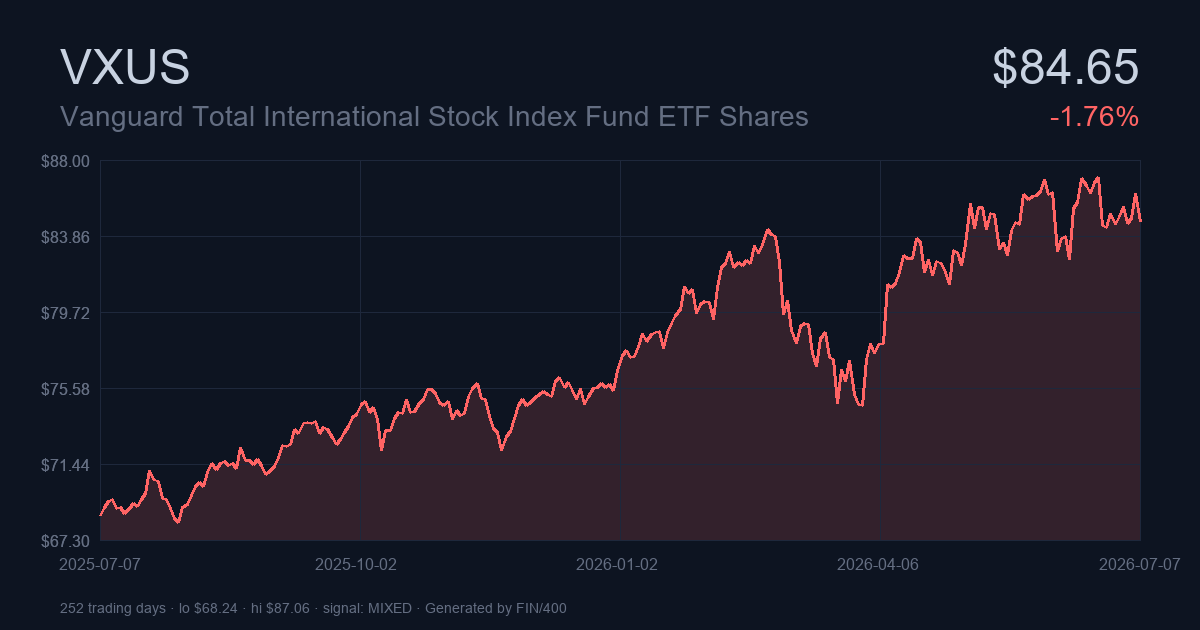
Technical analysis for Vanguard Total International Stock Index Fund ETF Shares (VXUS) — 2026-07-07 21:17 UTC, closing print $84.65.
VXUS closed at $84.65 today. Over the trailing 12 months the return has been +21.8%, and the composite of 11 technical indicators currently reads as mixed. The rest of this analysis unpacks what that composite is built from, which readings matter most right now, and what actionable conclusions a trader or investor can draw from the picture.
Bottom Line
Before the numbers, the summary — what our indicator stack currently says about VXUS:
- Short window (0-3mo): HOLD — weak conviction
- Long window (12mo+): HOLD — weak conviction
- Combined indicator signal: Mixed — weak strength
VXUS closed at $84.65 (-1.76% ▼ on the day), placing it 81% through its 52-week range of $67.85 to $88.62. Details in the sections below.
The Numbers That Matter
What jumps out looking at VXUS’s trailing data and current indicator readings:
- Trailing 1-year: VXUS has gained 21.82%, outpacing the long-run US equity average of roughly +10%.
- Volatility: 16.43% annualized is in the normal equity range. Sharpe 0.07, Sortino 0.07.
- Historical drawdown: worst peak-to-trough in the sample was -32.16%, bottomed on 2022-10-12.
- Technical composite: score +0.00 on -1/+1 scale — 3 bullish indicators vs 3 bearish.
- Verdicts: short-term HOLD (weak conviction), long-term HOLD (weak conviction).
A Quick Primer on VXUS
VXUS — full name Vanguard Total International Stock Index Fund ETF Shares — is an Exchange-Traded Fund (ETF) listed on NGM, denominated in USD providing international equity exposure. The read that follows works from Yahoo Finance’s public daily close series.
Key Facts
| Attribute | Value |
|---|---|
| Symbol | VXUS |
| Full name | Vanguard Total International Stock Index Fund ETF Shares |
| Exchange | NGM |
| Currency | USD |
| Type | etf |
| 52-week high | $88.62 |
| 52-week low | $67.85 |
| Position in 52w range | 81% |
How VXUS Has Traded Recently
The trailing-year picture for VXUS is unusually strong: +21.82%, a return well outside the normal-year band for equities. Recent three months for VXUS: +8.57%. Momentum is accelerating rather than fading. Year-to-date, VXUS is +10.60%, giving investors a real-time gauge of how the current calendar year has treated the position.
Total Returns Across Timeframes
The table below shows VXUS’s total return over several standard windows. Yahoo’s adjusted-close series bakes dividends into the price, so these numbers approximate total return (price appreciation plus reinvested dividends).
| Time window | Total return | Starting price |
|---|---|---|
| 1 Day | -1.76% | $86.17 |
| 1 Week | -0.33% | $84.93 |
| 1 Month | -1.86% | $86.25 |
| 3 Month | +8.57% | $77.97 |
| 6 Month | +10.60% | $76.54 |
| Year-to-Date | +10.60% | $76.54 |
| 1 Year | +21.82% | $69.49 |
| Full sample (5.0y) | +31.24% (CAGR +5.62%) | $64.50 |
Volatility, Drawdowns, and Risk-Adjusted Returns
At 16.43% annualized, VXUS’s volatility is within the standard equity band (roughly 15-18% for the S&P 500 historically). The Sharpe ratio of 0.07 is marginal — returns barely justify the volatility taken; a buy-and-hold Treasury allocation would have delivered comparable outcomes with far less anxiety. Sortino: 0.07. Investors should note the historical max drawdown of -32.16%, bottoming on 2022-10-12. A drawdown of that magnitude tests even disciplined long-term holders — the honest question is whether you’d stomach a repeat without capitulating at the low.
Risk metrics computed over trailing ~5.0 years of daily closes.
| Risk metric | Value | What it measures |
|---|---|---|
| Annualized return (CAGR) | 5.62% | Compound growth rate — geometric mean annualized |
| Annualized volatility | 16.43% | Standard deviation of returns, scaled to one year |
| Downside deviation | 16.90% | Volatility of negative returns only |
| Sharpe ratio | 0.07 | Excess return per unit of total volatility (vs 4.5% Rf) |
| Sortino ratio | 0.07 | Excess return per unit of downside volatility |
| Max drawdown | -32.16% | Largest peak-to-trough decline (bottomed 2022-10-12) |
VXUS, One-Year View
$  86.15 |                                                  *   *  * *
         |                                       *          |* * |* *
         |                                    *** |      *  | *  *
         |                                  * |   |     * **
         |                                 * *    |     |
         |                               **       **   *
$  77.39 |                           * **           ** |
         |               *  *** *  ** *               *
         |            *** **   * **
         |   *   *****
         |   |* *
$  68.63 |***  *
         +------------------------------------------------------------
          2025-07-07               2026-01-05               2026-06-30
From $68.63 at 2025-07-07 to $84.65 at 2026-07-07 — that’s the arc of the chart above, a net move of +23.34% across 252 trading sessions. The peak of the visible window sits recently at $87.06 (2026-06-22) — a bullish structural detail worth pairing with the momentum readings below.
Price Chart — Last 30 Days
$  87.06 |      *        *  **
         | *   * |*      |**  |       *
         | |***  * |    *     |    *  ||
         | |       |   *      | * * |* |
$  84.82 |*        |   |      ** *  *  *
         |         |** |
         |         *  ||
$  82.59 |            *
         +------------------------------
          2026-05-22 2026-06-15 2026-07-07
Zooming into the last 30 sessions lets you see the shorter-term structure clearly: recent support and resistance levels, breakout points, and near-term momentum shifts.
Signal-by-Signal Breakdown
Technical readings aren’t fortune-telling — they’re a compressed summary of what supply and demand have already done. The following section reads each signal for VXUS and combines them into a composite view.
Composite Verdict — 🟡 Mixed (Weak)
Aggregating the 11 signals for a single reading — 3 bullish, 3 bearish, 5 neutral. Composite score: +0.00. Unweighted; each indicator is given equal say.
That’s Weak mixed. Mixed readings frequently precede directional resolutions in either direction — smaller position sizes and closer attention over the following weeks is the sensible response.
Individual Signal Readings
The following table summarizes the current reading of each individual indicator. Detailed interpretation follows for the readings that are unusual enough to warrant explanation.
| Indicator | Signal | Interpretation |
|---|---|---|
| RSI-14 | 🟡 NEUTRAL | RSI 48 in neutral zone |
| MACD | 🔴 BEARISH | MACD Bearish (above zero) |
| MA-50 | 🔴 BEARISH | Price below MA50 ($84.67) |
| MA-200 | 🟢 BULLISH | Price above MA200 ($79.06) |
| MA-50/200 cross | 🟢 BULLISH | Golden Cross (MA50 > MA200) |
| Bollinger Bands | 🟡 NEUTRAL | Mid-band (pos 39%) |
| Volume | 🟡 NEUTRAL | Volume normal (1.00× avg) |
| ADX | 🟡 NEUTRAL | ADX 7 (weak trend, ranging) |
| Stochastic | 🟢 BULLISH | Stochastic 17 (oversold) |
| OBV | 🔴 BEARISH | OBV bearish divergence (price up, volume out) |
| ATR | 🟡 NEUTRAL | ATR $1.41 (1.7%) — normal |
What the Extreme Signals Are Telling Us
Rather than explain what every indicator is (that’s what Investopedia is for), this section focuses only on the VXUS readings that are actually generating a signal. The neutral ones you can pass over.
MACD
MACD: BEARISH — MACD Bearish (above zero). The trend-follower’s crossover signal for VXUS, tracking whether short-term momentum is accelerating or decelerating relative to the intermediate trend.
MA-50
Price vs MA-50: BEARISH — Price below MA50 ($84.67). The 50-day is the standard medium-term trend line; where VXUS’s close sits relative to it says a lot in one number.
MA-200
200-day MA read: BULLISH — Price above MA200 ($79.06). Long-term trend proxy; more meaningful than the 50-day for allocators who don’t trade weekly.
MA-50/200 cross
Cross indicator: BULLISH — Golden Cross (MA50 > MA200). Slow but consequential. A recent cross deserves more attention than one that’s been settled for months.
Stochastic
Stochastic signal: BULLISH — Stochastic 17 (oversold). Similar overbought/oversold framework to RSI but generally faster-triggering. Useful for near-term timing on top of a fundamental thesis.
OBV
OBV for VXUS: BEARISH — OBV bearish divergence (price up, volume out). Reveals whether volume is quietly accumulating or distributing behind the surface-level price action.
Two Horizons on VXUS: Short and Long
Below, VXUS’s outlook split into two horizons. Short-term (0-3 months) is momentum-driven; long-term (12+ months) leans on trend and volume-flow characteristics.
The 3-Month View: 🟡 HOLD (Weak)
Short-term signals are mixed. No decisive setup — waiting for a clearer catalyst is prudent. Existing positions can be held; new entries are not compelling.
What’s driving the hold take:
- RSI-14 at 48.3 — dead center. No directional edge from momentum alone right now.
- MACD: BEARISH — MACD Bearish (above zero). The trend-follower’s crossover signal for VXUS, tracking whether short-term momentum is accelerating or decelerating relative to the intermediate trend.
- Stochastic signal: BULLISH — Stochastic 17 (oversold). Similar overbought/oversold framework to RSI but generally faster-triggering. Useful for near-term timing on top of a fundamental thesis.
Long Horizon (12mo+): 🟡 HOLD — Weak
Long-term picture is inconclusive. Not decisively trending in either direction. Existing positions can be held; new core positions require clearer conviction.
Key factors supporting this hold view:
- Price is below the 50-day moving average — Price below MA50 ($84.67).
- Price is above the 200-day moving average — Price above MA200 ($79.06).
- Price vs MA-50: BEARISH — Price below MA50 ($84.67). The 50-day is the standard medium-term trend line; where VXUS’s close sits relative to it says a lot in one number.
- ADX reading: NEUTRAL — ADX 7 (weak trend, ranging). Trend strength — not direction. Above 25 = trending market where momentum strategies work; below 20 = chop where mean-reversion works.
- Volume analysis for VXUS: NEUTRAL — Volume normal (1.00× avg). The tell that separates real moves from technical drift.
- Trading at 81% of the 52-week range — extended toward highs.
Data and Method
How this analysis is built: daily closes from Yahoo Finance’s chart endpoint (dividend-adjusted), returns computed geometrically, volatility annualized with the standard sqrt-252 convention. The composite reading is a flat unweighted tally of individual indicator verdicts — no black-box weighting.
The Fine Print
Nothing here constitutes personalized financial advice. It’s a rules-based technical read, published for education and discussion. Past performance doesn’t guarantee anything; indicators can and do fail. Talk to a licensed advisor before making trades based on this analysis.
Prepared by FIN/400 · 2026-07-07 21:17 UTC · Prices from Yahoo Finance chart API · Point-in-time analysis, not a real-time feed.
Leave a Reply