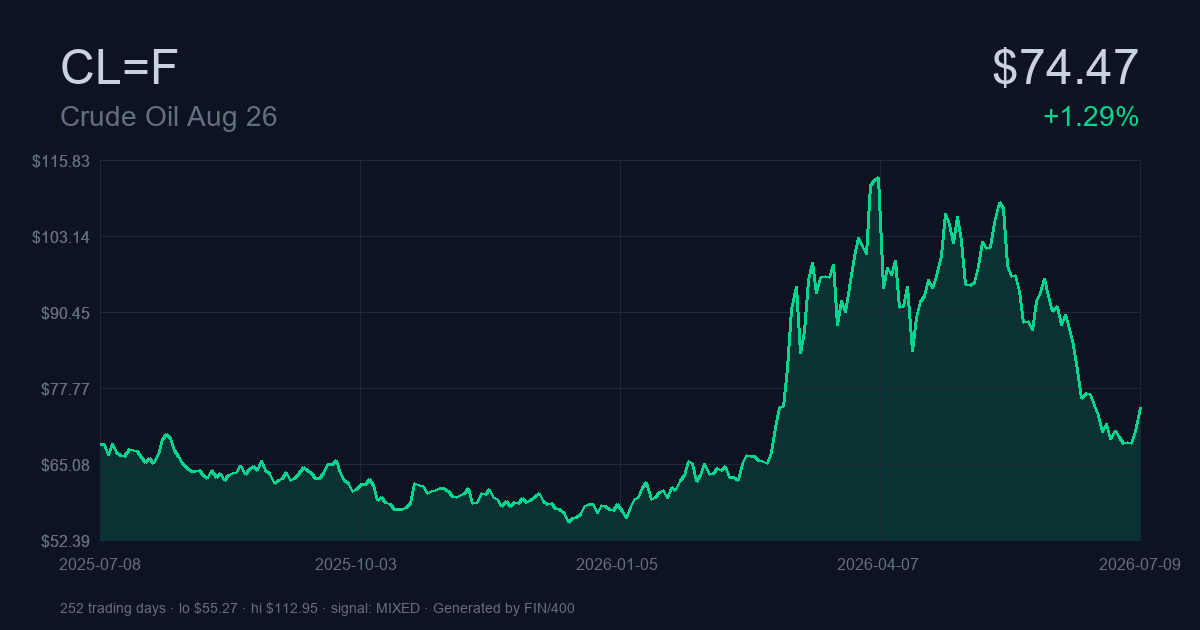
Deep-dive on WTI Crude Oil Futures — ticker CL=F. As of 2026-07-08 20:30 UTC, the front-month contract is trading at $74.47.
CL is trading at $74.47, but the story is the pace: CL has lost 34.1% in just the last three months alone, a move large enough that mean-reversion becomes a genuine tactical consideration alongside trend-following logic. One risk-management note up front: annualized volatility for CL is running at 40.9%, well above broad-market norms. Position sizing should reflect that, regardless of which side of the trade this analysis favors.
Where I Land
Before the numbers, the summary — what our indicator stack currently says about CL=F:
- Short-term (0-3 months): BUY — moderate conviction
- Long-term (12+ months): HOLD — weak conviction
- Composite technical signal: Mixed — weak strength
At the current price of $74.47 (day change: +1.29% ▲), CL=F sits at 30% of its 52-week range ($54.98 – $119.48). Full analysis follows.
What to Know
Here’s what stands out from the numbers on CL=F:
- Trailing 1-year: CL=F has gained 9.63%, roughly in line with the long-run US equity average of roughly +10%.
- Volatility: 40.95% annualized is elevated. Sharpe -0.10, Sortino -0.09.
- Historical drawdown: worst peak-to-trough in the sample was -55.32%, bottomed on 2025-12-16.
- Technical composite: score +0.00 on -1/+1 scale — 3 bullish indicators vs 3 bearish.
- Verdicts: short-term BUY (moderate conviction), long-term HOLD (weak conviction).
About CL=F
For those less familiar: CL=F is the ticker for WTI Crude Oil futures, a energy contract on NYMEX quoted per barrels. The analysis reads from Yahoo’s continuous front-month series — the standard price feed for energy technicals.
The Numbers
| Attribute | Value |
|---|---|
| Symbol | CL=F |
| Full name | Crude Oil Aug 26 |
| Exchange | NYM |
| Currency | USD |
| Type | future |
| 52-week high | $119.48 |
| 52-week low | $54.98 |
| Position in 52w range | 30% |
Price History and Return Profile
CL=F posted a positive but modest +9.63% return over the trailing year, underperforming the long-run average. The complication: CL=F’s last three months are -34.07%, giving back part of the trailing-year gain. Either a pullback in an uptrend or the start of a topping process. The calendar-year read on CL=F: +29.92% YTD.
CL=F’s Returns by Window
Reading down the table: how CL=F has performed across each standard trailing window, on a total-return basis (dividends reinvested via Yahoo’s adjusted closes).
| Time window | Total return | Starting price |
|---|---|---|
| 1 Day | +5.72% | $70.44 |
| 1 Week | +7.15% | $69.50 |
| 1 Month | -17.75% | $90.54 |
| 3 Month | -34.07% | $112.95 |
| 6 Month | +27.69% | $58.32 |
| Year-to-Date | +29.92% | $57.32 |
| 1 Year | +9.63% | $67.93 |
| Full sample (5.0y) | +2.10% (CAGR +0.42%) | $72.94 |
Risk-Metric Deep Dive
40.95% annualized volatility for CL=F is elevated enough that position sizing dominates other considerations — this is not a set-and-forget name. The Sharpe ratio of -0.10 is negative — CL=F has failed to compensate investors for the volatility they endured, historically underperforming the risk-free rate. Sortino: -0.09. Investors should note the historical max drawdown of -55.32%, bottoming on 2025-12-16. A drawdown of that magnitude tests even disciplined long-term holders — the honest question is whether you’d stomach a repeat without capitulating at the low.
Risk metrics computed over trailing ~5.0 years of daily closes.
| Risk metric | Value | What it measures |
|---|---|---|
| Annualized return (CAGR) | 0.42% | Compound growth rate — geometric mean annualized |
| Annualized volatility | 40.95% | Standard deviation of returns, scaled to one year |
| Downside deviation | 44.84% | Volatility of negative returns only |
| Sharpe ratio | -0.10 | Excess return per unit of total volatility (vs 4.5% Rf) |
| Sortino ratio | -0.09 | Excess return per unit of downside volatility |
| Max drawdown | -55.32% | Largest peak-to-trough decline (bottomed 2025-12-16) |
CL=F, One-Year View
$ 107.77 |                                                    *
         |                                            *    * * |
         |                                         ** ||   ||| |
         |                                        *  ||** * *  ***
         |                                        |  *   *        |
         |                                        |               *
$  81.52 |                                        |                |
         |                                        |                *
         |* * *                                  *                  **
         | * * *****  ***                   *****
         |          **   ** ********* ** ***
$  55.27 |                 *         *  *
         +------------------------------------------------------------
          2025-07-08               2026-01-06               2026-07-01
Reading the chart: start at $68.33 on 2025-07-08, end at $74.47 on 2026-07-09. That’s +8.99% net across 1 year of daily bars.
Recent 30-Day Action
$  96.02 |      *
         |*   ** ***
         | ***      ***
         |             *
$  82.28 |              *
         |               ****          *
         |                   * * *     |
$  68.55 |                    * * *****
         +------------------------------
          2026-05-26 2026-06-16 2026-07-09
Zooming into the last 30 sessions lets you see the shorter-term structure clearly: recent support and resistance levels, breakout points, and near-term momentum shifts.
Signal-by-Signal Breakdown
Below is the technical breakdown. Rather than lean on one indicator, we aggregate 11 well-established readings covering momentum, trend, volatility, and volume, then look at where they agree and where they disagree.
The Aggregate: 🟡 Mixed — Weak
The composite signal aggregates 11 independent technical indicators — each casting a bullish, bearish, or neutral vote — into a single summary reading. In this analysis, 3 of 11 indicators are bullish, 3 are bearish, and 5 are neutral, yielding a net score of +0.00 on a scale from -1 (unanimously bearish) to +1 (unanimously bullish).
That’s Weak mixed. Mixed readings frequently precede directional resolutions in either direction — smaller position sizes and closer attention over the following weeks is the sensible response.
The 11-Indicator Table
Below is each indicator’s current signal. Where a reading is close to neutral, no additional commentary is needed — the number speaks for itself. Where a reading is unusual, the interpretation follows.
| Indicator | Signal | Interpretation |
|---|---|---|
| RSI-14 | 🟡 NEUTRAL | RSI 43 in neutral zone |
| MACD | 🟢 BULLISH | MACD Bullish (still negative) |
| MA-50 | 🔴 BEARISH | Price below MA50 ($88.94) |
| MA-200 | 🟢 BULLISH | Price above MA200 ($74.13) |
| MA-50/200 cross | 🟢 BULLISH | Golden Cross (MA50 > MA200) |
| Bollinger Bands | 🟡 NEUTRAL | Mid-band (pos 46%) |
| Volume | 🟡 NEUTRAL | Volume normal (0.84× avg) |
| ADX | 🔴 BEARISH | ADX 35 (strong downtrend) |
| Stochastic | 🟡 NEUTRAL | Stochastic 57 |
| OBV | 🔴 BEARISH | OBV falling (distribution) |
| ATR | 🟡 NEUTRAL | ATR $3.99 (5.4%) — high volatility |
What the Extreme Signals Are Telling Us
Rather than explain what every indicator is (that’s what Investopedia is for), this section focuses only on the CL=F readings that are actually generating a signal. The neutral ones you can pass over.
MACD
MACD signal for CL=F: BULLISH — MACD Bullish (still negative). The 12/26/9 configuration is the classic trend-following setup; a fresh crossover is the specific bullish or bearish trigger.
MA-50
Price vs MA-50: BEARISH — Price below MA50 ($88.94). The 50-day is the standard medium-term trend line; where CL=F’s close sits relative to it says a lot in one number.
MA-200
MA-200 status for CL=F: BULLISH — Price above MA200 ($74.13). The classic bull-market/bear-market dividing line.
MA-50/200 cross
Golden/Death Cross state: BULLISH — Golden Cross (MA50 > MA200). Widely followed enough that its signals partly become self-fulfilling — worth paying attention to for that reason alone.
ADX
ADX reading: BEARISH — ADX 35 (strong downtrend). Trend strength — not direction. Above 25 = trending market where momentum strategies work; below 20 = chop where mean-reversion works.
OBV
OBV signal: BEARISH — OBV falling (distribution). Cumulative volume flow — divergences between OBV and price are the classic setup this indicator identifies.
Two Horizons on CL=F: Short and Long
Trading verdicts come in two horizons — a short-term view based mostly on momentum and oscillator readings, and a long-term view based on trend structure and volume flow. They can (and often do) disagree.
The 3-Month View: 🟢 BUY (Moderate)
Short-term signals lean positive but not unanimously. A partial position or wait-for-confirmation stance is reasonable. Watch for a break above recent resistance.
What’s driving the buy take:
- RSI-14 at 42.8 — dead center. No directional edge from momentum alone right now.
- MACD signal for CL=F: BULLISH — MACD Bullish (still negative). The 12/26/9 configuration is the classic trend-following setup; a fresh crossover is the specific bullish or bearish trigger.
Long Horizon (12mo+): 🟡 HOLD — Weak
Long-term picture is inconclusive. Not decisively trending in either direction. Existing positions can be held; new core positions require clearer conviction.
Factors weighing on this hold conclusion:
- Price is below the 50-day moving average — Price below MA50 ($88.94).
- Price is above the 200-day moving average — Price above MA200 ($74.13).
- Price vs MA-50: BEARISH — Price below MA50 ($88.94). The 50-day is the standard medium-term trend line; where CL=F’s close sits relative to it says a lot in one number.
- ADX reading: BEARISH — ADX 35 (strong downtrend). Trend strength — not direction. Above 25 = trending market where momentum strategies work; below 20 = chop where mean-reversion works.
- Volume signal: NEUTRAL — Volume normal (0.84× avg). Volume-price confirmation — rising prices need rising participation to be sustainable; the opposite pattern usually precedes reversals.
Data and Method
All figures are computed from Yahoo Finance’s public chart endpoint. Returns use dividend-adjusted closes; volatility is annualized daily-return standard deviation using a 252-trading-day year; Sharpe and Sortino ratios assume a 4.5% risk-free rate. The composite signal is an unweighted majority vote of 11 indicators — deliberately simple to keep it auditable rather than clever.
Disclaimer
Read this as a research note, not a call to action. Technical readings can be wrong, especially at inflection points. This isn’t personalized advice — your situation and risk tolerance matter more than any indicator, and a licensed advisor is the right professional to help weigh both.
Prepared by FIN/400 · 2026-07-08 20:30 UTC · Prices from Yahoo Finance chart API · Point-in-time analysis, not a real-time feed.
Leave a Reply