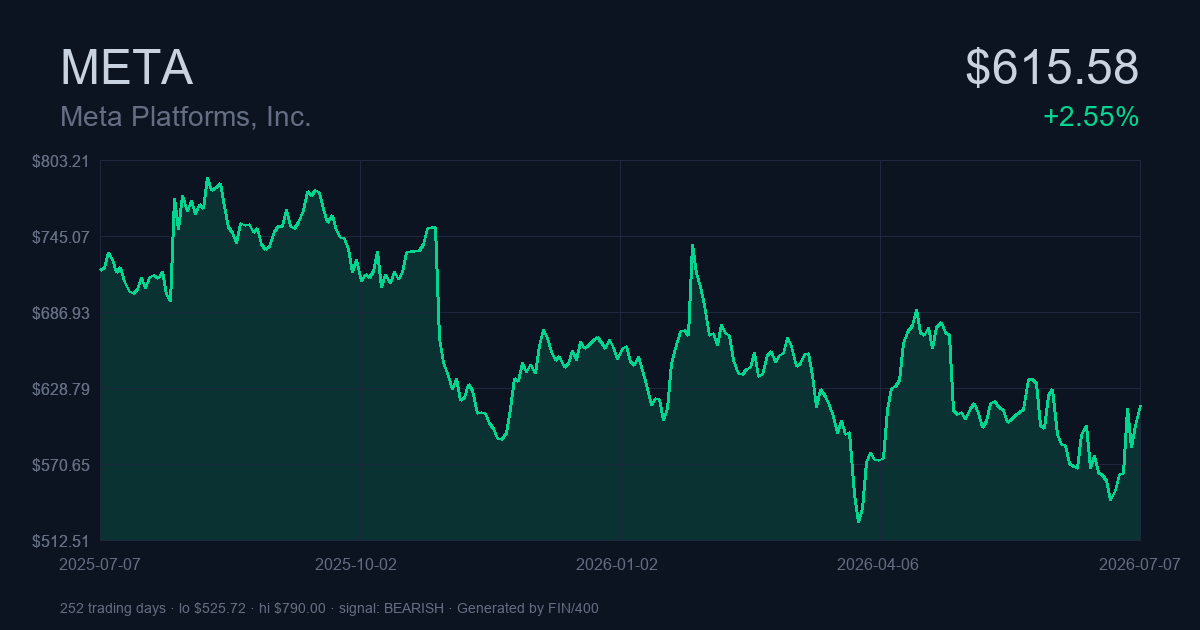
Deep-dive research on Meta Platforms, Inc. (META) — published 2026-07-07 18:56 UTC, current price $615.58.
META closed at $615.58 today. Over the trailing 12 months the return has been -14.4%, and the composite of 11 technical indicators currently reads as bearish. The rest of this analysis unpacks what that composite is built from, which readings matter most right now, and what actionable conclusions a trader or investor can draw from the picture. One risk-management note up front: annualized volatility for META is running at 44.9%, well above broad-market norms. Position sizing should reflect that, regardless of which side of the trade this analysis favors.
What the Signals Say
The technical picture for META right now, distilled from every reading we track:
- Near-term view (0-3mo): HOLD — weak conviction
- Multi-year view (12mo+): AVOID — moderate conviction
- Composite reading: Bearish — moderate strength
META closed at $615.58 (+2.55% ▲ on the day), placing it 35% through its 52-week range of $520.26 to $796.25. Details in the sections below.
Key Takeaways
The signal-to-noise summary for META, distilled down:
- Trailing 1-year: META has lost 14.39%, underperforming the long-run US equity average of roughly +10%.
- Volatility: 44.86% annualized is elevated. Sharpe 0.17, Sortino 0.17.
- Historical drawdown: worst peak-to-trough in the sample was -76.74%, bottomed on 2022-11-03.
- Technical composite: score -0.33 on -1/+1 scale — 2 bullish indicators vs 4 bearish.
- Verdicts: short-term HOLD (weak conviction), long-term AVOID (moderate conviction).
What Is META?
Meet META: Meta Platforms, Inc., an equity, trading on NMS in USD. The technical, return, and risk analysis below draws entirely from the public trailing history for this ticker.
Key Facts
| Attribute | Value |
|---|---|
| Symbol | META |
| Full name | Meta Platforms, Inc. |
| Exchange | NMS |
| Currency | USD |
| Type | equity |
| 52-week high | $796.25 |
| 52-week low | $520.26 |
| Position in 52w range | 35% |
Signal-by-Signal Breakdown
Below is the technical breakdown. Rather than lean on one indicator, we aggregate 11 well-established readings covering momentum, trend, volatility, and volume, then look at where they agree and where they disagree.
Composite Verdict — 🔴 Bearish (Moderate)
The composite signal aggregates 11 independent technical indicators — each casting a bullish, bearish, or neutral vote — into a single summary reading. In this analysis, 2 of 11 indicators are bullish, 4 are bearish, and 5 are neutral, yielding a net score of -0.33 on a scale from -1 (unanimously bearish) to +1 (unanimously bullish).
That reads Moderate bearish. The breadth of the weakness (across trend, momentum, and volume categories) is what makes this more than a single-indicator warning.
The 11-Indicator Table
Below is each indicator’s current signal. Where a reading is close to neutral, no additional commentary is needed — the number speaks for itself. Where a reading is unusual, the interpretation follows.
| Indicator | Signal | Interpretation |
|---|---|---|
| RSI-14 | 🟡 NEUTRAL | RSI 57 in neutral zone |
| MACD | 🟢 BULLISH | MACD Bullish (still negative) |
| MA-50 | 🟢 BULLISH | Price above MA50 ($602.87) |
| MA-200 | 🔴 BEARISH | Price below MA200 ($644.82) |
| MA-50/200 cross | 🔴 BEARISH | Death Cross (MA50 < MA200) |
| Bollinger Bands | 🔴 BEARISH | Near upper band (overbought) |
| Volume | 🟡 NEUTRAL | Volume normal (1.02× avg) |
| ADX | 🟡 NEUTRAL | ADX 18 (weak trend, ranging) |
| Stochastic | 🔴 BEARISH | Stochastic 86 (overbought) |
| OBV | 🟡 NEUTRAL | OBV trend mixed |
| ATR | 🟡 NEUTRAL | ATR $22.65 (3.7%) — normal |
Zooming In on the Non-Neutral Signals
Skipping the neutral readings for space — here are only the META indicators that are currently producing a directional signal worth thinking through.
MACD
MACD: BULLISH — MACD Bullish (still negative). The trend-follower’s crossover signal for META, tracking whether short-term momentum is accelerating or decelerating relative to the intermediate trend.
MA-50
Price vs MA-50: BULLISH — Price above MA50 ($602.87). The 50-day is the standard medium-term trend line; where META’s close sits relative to it says a lot in one number.
MA-200
MA-200 status for META: BEARISH — Price below MA200 ($644.82). The classic bull-market/bear-market dividing line.
MA-50/200 cross
MA-50/200 cross: BEARISH — Death Cross (MA50 < MA200). Golden crosses and death crosses have poor short-term reliability but decent multi-month reliability. Where META sits on this metric shapes multi-month positioning.
Bollinger Bands
Bollinger status for META: BEARISH — Near upper band (overbought). Reading the bands as a volatility envelope: an upper-band touch flags extension risk, a lower-band touch flags capitulation.
Stochastic
Stoch reading for META: BEARISH — Stochastic 86 (overbought). Short-term extreme detector; triggers earlier than RSI but has more false signals.
META’s Recent Performance
The story for META over the past year is a -14.39% drawdown — the kind of move that signals either a broken thesis or a genuine value opportunity. There’s a wrinkle: the last three months for META are +7.43% positive even though the trailing year is red. Bases like that sometimes precede reversals. YTD stands at -5.36% for META — the reference number most holders actually track relative to their expectations at the start of the year.
Total Returns Across Timeframes
The table below shows META’s total return over several standard windows. Yahoo’s adjusted-close series bakes dividends into the price, so these numbers approximate total return (price appreciation plus reinvested dividends).
| Time window | Total return | Starting price |
|---|---|---|
| 1 Day | +2.55% | $600.29 |
| 1 Week | +9.42% | $562.60 |
| 1 Month | -1.91% | $627.57 |
| 3 Month | +7.43% | $573.02 |
| 6 Month | -5.36% | $650.41 |
| Year-to-Date | -5.36% | $650.41 |
| 1 Year | -14.39% | $719.01 |
| Full sample (5.0y) | +78.09% (CAGR +12.30%) | $345.65 |
Risk-Metric Deep Dive
Volatility on META is 44.86% annualized — a high-vol ticker. Position sizing needs to reflect that even correct trades will pass through uncomfortable mark-to-market moves. Sharpe at 0.17 tells a mediocre risk-adjusted story — investors who wanted returns have gotten some, but they paid a lot of volatility to get it. Sortino 0.17. The max drawdown of -76.74% (bottom: 2022-11-03) is the honest worst-case in the record. Any position sized without room to weather a repeat is over-sized.
Risk metrics computed over trailing ~5.0 years of daily closes.
| Risk metric | Value | What it measures |
|---|---|---|
| Annualized return (CAGR) | 12.30% | Compound growth rate — geometric mean annualized |
| Annualized volatility | 44.86% | Standard deviation of returns, scaled to one year |
| Downside deviation | 47.03% | Volatility of negative returns only |
| Sharpe ratio | 0.17 | Excess return per unit of total volatility (vs 4.5% Rf) |
| Sortino ratio | 0.17 | Excess return per unit of downside volatility |
| Max drawdown | -76.74% | Largest peak-to-trough decline (bottomed 2022-11-03) |
The Trailing-Year Chart
$ 785.23 |       *    *
         |     ** |  * *
         |     |  ***   * * **
         |** * |         * *  |
         |  * *               |                          *
         |                    |        *    ***          ||*
$ 660.80 |                    |    **** ** *   * **      |* |
         |                    **  *       *     *  **   *   |   *
         |                      * |                  |  |   **** *
         |                       *                   * *          |
         |                                            ||          ****
$ 536.38 |                                            *
         +------------------------------------------------------------
          2025-07-07               2026-01-05               2026-06-30
From $718.35 at 2025-07-07 to $615.58 at 2026-07-07 — that’s the arc of the chart above, a net move of -14.31% across 252 trading sessions. The high of $790.00 was set early in the window on 2025-08-12, followed by a period of consolidation or decline. Whether the security has re-based for another leg higher or continues to drift depends on the trend indicators below.
Price Chart — Last 30 Days
$ 635.29 |  ***
         |  |  | **                    *
         |**   | | |                *  |
         |     **  *     **         ||*
$ 589.08 |          **   | |*       |*
         |            ***  * *     *
         |                    ** **
$ 542.87 |                      *
         +------------------------------
          2026-05-22 2026-06-15 2026-07-07
The 30-day chart offers a tighter view of recent price action — useful for identifying short-term support, resistance, and potential entry zones for tactical positions.
Where This Leaves a Trader — META
Below, META’s outlook split into two horizons. Short-term (0-3 months) is momentum-driven; long-term (12+ months) leans on trend and volume-flow characteristics.
Short Horizon (0-3mo): 🟡 HOLD — Weak
Short-term signals are mixed. No decisive setup — waiting for a clearer catalyst is prudent. Existing positions can be held; new entries are not compelling.
Factors weighing on this hold conclusion:
- RSI reads 57.4, mid-range. META’s momentum signal is neutral; look elsewhere for the actionable read.
- MACD: BULLISH — MACD Bullish (still negative). The trend-follower’s crossover signal for META, tracking whether short-term momentum is accelerating or decelerating relative to the intermediate trend.
- Stoch reading for META: BEARISH — Stochastic 86 (overbought). Short-term extreme detector; triggers earlier than RSI but has more false signals.
- Bollinger status for META: BEARISH — Near upper band (overbought). Reading the bands as a volatility envelope: an upper-band touch flags extension risk, a lower-band touch flags capitulation.
Long-Term Outlook (12+ Months): 🔴 AVOID (Moderate Conviction)
Long-term structure leans bearish. Wait for a change in trend character (e.g. reclaim of MA-200 or bullish MA cross) before initiating a core position.
Factors weighing on this avoid conclusion:
- Price is above the 50-day moving average — Price above MA50 ($602.87).
- Price is below the 200-day moving average — Price below MA200 ($644.82).
- Price vs MA-50: BULLISH — Price above MA50 ($602.87). The 50-day is the standard medium-term trend line; where META’s close sits relative to it says a lot in one number.
- ADX reading: NEUTRAL — ADX 18 (weak trend, ranging). Trend strength — not direction. Above 25 = trending market where momentum strategies work; below 20 = chop where mean-reversion works.
Methodology in One Paragraph
All figures are computed from Yahoo Finance’s public chart endpoint. Returns use dividend-adjusted closes; volatility is annualized daily-return standard deviation using a 252-trading-day year; Sharpe and Sortino ratios assume a 4.5% risk-free rate. The composite signal is an unweighted majority vote of 11 indicators — deliberately simple to keep it auditable rather than clever.
Before Acting on Any of This
This is algorithmic technical analysis for informational purposes only — not investment advice or a solicitation. Technical indicators produce false signals, particularly near market turning points. Do your own research; consult a licensed advisor before acting.
FIN/400 · run at 2026-07-07 18:56 UTC · data source: Yahoo Finance · figures are snapshots and will drift as META continues trading.
Leave a Reply