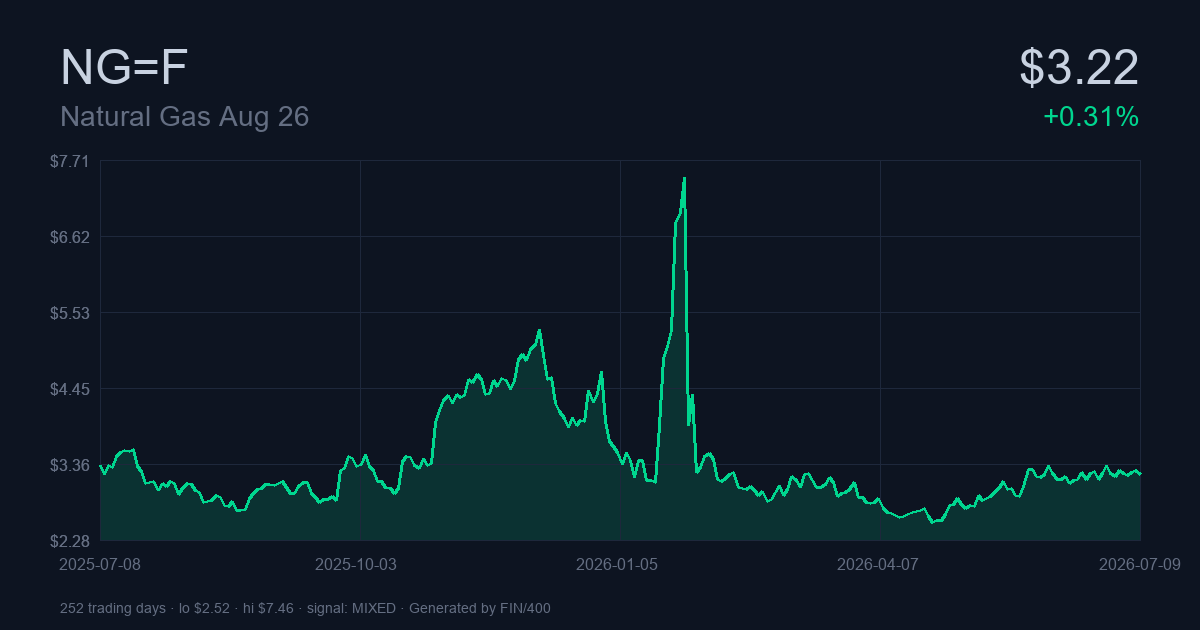
Technical analysis of Henry Hub Natural Gas Futures (NG=F) — front-month continuous contract, published 2026-07-08 20:47 UTC, current price $3.22.
NG sits at $3.22, in the bottom 15% of its 52-week range ($2.48 to $7.83). Positions this low usually reflect either a value opportunity setting up or continued weakness — the indicator suite that follows helps tell them apart. One risk-management note up front: annualized volatility for NG is running at 85.0%, well above broad-market norms. Position sizing should reflect that, regardless of which side of the trade this analysis favors.
Bottom Line
The technical picture for NG=F right now, distilled from every reading we track:
- Trader horizon: AVOID — moderate conviction
- Investor horizon: HOLD — weak conviction
- Aggregate technical read: Mixed — weak strength
Current price $3.22, day move +0.31% ▲. That puts NG=F in the 14th percentile of its 52-week range ($2.48 low, $7.83 high).
Key Takeaways
What jumps out looking at NG=F’s trailing data and current indicator readings:
- Trailing 1-year: NG=F has lost 5.66%, underperforming the long-run US equity average of roughly +10%.
- Volatility: 84.96% annualized is elevated. Sharpe -0.08, Sortino -0.08.
- Historical drawdown: worst peak-to-trough in the sample was -83.73%, bottomed on 2024-03-26.
- Technical composite: score +0.00 on -1/+1 scale — 3 bullish indicators vs 3 bearish.
- Verdicts: short-term AVOID (moderate conviction), long-term HOLD (weak conviction).
Meet NG=F
NG=F — Henry Hub Natural Gas Futures — is the front-month energy contract listed on NYMEX, quoted per MMBtu. The chart data below is the continuous roll-adjusted series, which is what Yahoo publishes and what most technical analysis systems use for futures.
Key Facts
| Attribute | Value |
|---|---|
| Symbol | NG=F |
| Full name | Natural Gas Aug 26 |
| Exchange | NYM |
| Currency | USD |
| Type | future |
| 52-week high | $7.83 |
| 52-week low | $2.48 |
| Position in 52w range | 14% |
Reading the Chart Through 11 Lenses
The next section digs into the technical signals. Each individual indicator captures something different — momentum, trend, volatility, volume flow — and the composite reading only carries weight when several agree.
Composite Signal: 🟡 Mixed (Weak)
The composite signal aggregates 11 independent technical indicators — each casting a bullish, bearish, or neutral vote — into a single summary reading. In this analysis, 3 of 11 indicators are bullish, 3 are bearish, and 5 are neutral, yielding a net score of +0.00 on a scale from -1 (unanimously bearish) to +1 (unanimously bullish).
This is a Weak mixed verdict, meaning some indicators lean bullish and others bearish. Mixed readings often occur near inflection points — markets transitioning from an uptrend to consolidation, or from a correction to a recovery. They call for patience rather than conviction.
The 11-Indicator Table
Below is each indicator’s current signal. Where a reading is close to neutral, no additional commentary is needed — the number speaks for itself. Where a reading is unusual, the interpretation follows.
| Indicator | Signal | Interpretation |
|---|---|---|
| RSI-14 | 🟡 NEUTRAL | RSI 53 in neutral zone |
| MACD | 🔴 BEARISH | MACD Bearish (above zero) |
| MA-50 | 🟢 BULLISH | Price above MA50 ($3.05) |
| MA-200 | 🔴 BEARISH | Price below MA200 ($3.46) |
| MA-50/200 cross | 🔴 BEARISH | Death Cross (MA50 < MA200) |
| Bollinger Bands | 🟡 NEUTRAL | Mid-band (pos 56%) |
| Volume | 🟡 NEUTRAL | Volume normal (0.89× avg) |
| ADX | 🟢 BULLISH | ADX 29 (strong uptrend) |
| Stochastic | 🟡 NEUTRAL | Stochastic 31 |
| OBV | 🟢 BULLISH | OBV rising (accumulation) |
| ATR | 🟡 NEUTRAL | ATR $0.13 (4.0%) — high volatility |
Zooming In on the Non-Neutral Signals
Rather than explain what every indicator is (that’s what Investopedia is for), this section focuses only on the NG=F readings that are actually generating a signal. The neutral ones you can pass over.
MACD
MACD signal for NG=F: BEARISH — MACD Bearish (above zero). The 12/26/9 configuration is the classic trend-following setup; a fresh crossover is the specific bullish or bearish trigger.
MA-50
50-day MA read: BULLISH — Price above MA50 ($3.05). For NG=F, this is the dividing line between an intact medium-term trend and one that has just cracked.
MA-200
MA-200 status for NG=F: BEARISH — Price below MA200 ($3.46). The classic bull-market/bear-market dividing line.
MA-50/200 cross
MA-50/200 cross: BEARISH — Death Cross (MA50 < MA200). Golden crosses and death crosses have poor short-term reliability but decent multi-month reliability. Where NG=F sits on this metric shapes multi-month positioning.
ADX
ADX status for NG=F: BULLISH — ADX 29 (strong uptrend). Tells you how to trade the ticker (trend-following vs mean-reversion), not which side to take.
OBV
OBV for NG=F: BULLISH — OBV rising (accumulation). Reveals whether volume is quietly accumulating or distributing behind the surface-level price action.
NG=F’s Recent Performance
Down 5.66% over the past year, NG=F sits in negative territory but hasn’t experienced a full-scale bear market. There’s a wrinkle: the last three months for NG=F are +12.16% positive even though the trailing year is red. Bases like that sometimes precede reversals. YTD stands at -11.03% for NG=F — the reference number most holders actually track relative to their expectations at the start of the year.
NG=F’s Returns by Window
Here are NG=F’s returns over the windows people usually care about. Yahoo’s adjusted closes include reinvested dividends, so these are effectively total-return figures.
| Time window | Total return | Starting price |
|---|---|---|
| 1 Day | -1.41% | $3.27 |
| 1 Week | -1.71% | $3.28 |
| 1 Month | -0.31% | $3.23 |
| 3 Month | +12.16% | $2.87 |
| 6 Month | -8.63% | $3.52 |
| Year-to-Date | -11.03% | $3.62 |
| 1 Year | -5.66% | $3.41 |
| Full sample (5.0y) | -12.72% (CAGR -2.69%) | $3.69 |
Risk and Volatility Analysis
Volatility on NG=F is 84.96% annualized — a high-vol ticker. Position sizing needs to reflect that even correct trades will pass through uncomfortable mark-to-market moves. The Sharpe ratio of -0.08 is negative — NG=F has failed to compensate investors for the volatility they endured, historically underperforming the risk-free rate. Sortino: -0.08. Max drawdown was -83.73% (low: 2024-03-26) — the worst-case realized experience in the sample. Sizing that permits sitting through a repeat is the right frame.
Risk metrics computed over trailing ~5.0 years of daily closes.
| Risk metric | Value | What it measures |
|---|---|---|
| Annualized return (CAGR) | -2.69% | Compound growth rate — geometric mean annualized |
| Annualized volatility | 84.96% | Standard deviation of returns, scaled to one year |
| Downside deviation | 89.65% | Volatility of negative returns only |
| Sharpe ratio | -0.08 | Excess return per unit of total volatility (vs 4.5% Rf) |
| Sortino ratio | -0.08 | Excess return per unit of downside volatility |
| Max drawdown | -83.73% | Largest peak-to-trough decline (bottomed 2024-03-26) |
The Trailing-Year Chart
$   5.28 |                                 *
         |                         *       ||
         |                         ||  *   ||
         |                      *** *  ||  ||
         |                    **     | ||  ||
         |                    |      |* |  |*
$   3.90 |                    |      *  |  | |
         | **               * |         |* | *
         |*  |          **  |*          * ||  *     *           *  ***
         |   ***   **** | **              *    ***** *        * |**
         |      ***    *                              ** * *** *
$   2.52 |                                              * *
         +------------------------------------------------------------
          2025-07-08               2026-01-06               2026-07-01
The chart above traces the price journey from $3.34 on 2025-07-08 to $3.22 on 2026-07-09, a net change of -3.62% over roughly 1 year(s) of trading. The sample low $2.52 (2026-04-24) is very recent — meaningful because it signals downside risk is currently active, not hypothetical.
The Last 30 Days
$   3.34 |       *             *
         |  **   ||         *  || *   *
         |  | | * *  *   * * |* * |*** *
         |  | **   ** |** *  *   *
$   3.12 |  |         *
         | *
         | |
$   2.89 |*
         +------------------------------
          2026-05-26 2026-06-16 2026-07-09
The 30-day chart offers a tighter view of recent price action — useful for identifying short-term support, resistance, and potential entry zones for tactical positions.
Trading Thesis for NG=F
The following thesis distinguishes between two independent time horizons: short-term (0-3 months) and long-term (12+ months). These horizons draw on different subsets of the indicators above.
The 3-Month View: 🔴 AVOID (Moderate)
Short-term momentum is soft. New long positions carry elevated risk of immediate drawdown. Wait for a clearer reversal signal (e.g. RSI < 30 or bullish MACD cross).
Key factors supporting this avoid view:
- RSI reads 52.5, mid-range. NG=F’s momentum signal is neutral; look elsewhere for the actionable read.
- MACD signal for NG=F: BEARISH — MACD Bearish (above zero). The 12/26/9 configuration is the classic trend-following setup; a fresh crossover is the specific bullish or bearish trigger.
The Year+ View: 🟡 HOLD (Weak)
Long-term picture is inconclusive. Not decisively trending in either direction. Existing positions can be held; new core positions require clearer conviction.
What’s driving the hold take:
- Price is above the 50-day moving average — Price above MA50 ($3.05).
- Price is below the 200-day moving average — Price below MA200 ($3.46).
- 50-day MA read: BULLISH — Price above MA50 ($3.05). For NG=F, this is the dividing line between an intact medium-term trend and one that has just cracked.
- ADX status for NG=F: BULLISH — ADX 29 (strong uptrend). Tells you how to trade the ticker (trend-following vs mean-reversion), not which side to take.
- Volume analysis for NG=F: NEUTRAL — Volume normal (0.89× avg). The tell that separates real moves from technical drift.
- Trading at 14% of the 52-week range — near the low end, potential value zone.
Data and Method
How this analysis is built: daily closes from Yahoo Finance’s chart endpoint (dividend-adjusted), returns computed geometrically, volatility annualized with the standard sqrt-252 convention. The composite reading is a flat unweighted tally of individual indicator verdicts — no black-box weighting.
Before Acting on Any of This
Consider this a technical opinion, not a recommendation. The author may or may not hold positions in the securities analyzed. All investment decisions require your own judgment about your personal risk tolerance and financial situation — please consult a qualified advisor before acting.
Report generated by FIN/400 on 2026-07-08 20:47 UTC. Data via Yahoo Finance. Snapshot as of the generation timestamp; markets move continuously.
Leave a Reply