Generated 2026-07-05 15:31 UTC
Current: $744.78 · Day change: -0.13% ▼
Overview
| Symbol | SPY |
| Full name | State Street SPDR S&P 500 ETF Trust |
| Exchange | PCX |
| Currency | USD |
| Type | etf |
| 52-week high | $760.40 |
| 52-week low | $617.87 |
| Position in 52w range | 89% |
Price Action
Returns
| Window | Return | Starting price |
|---|---|---|
| 1 Day | -0.13% | $745.76 |
| 1 Week | +1.43% | $734.30 |
| 1 Month | -1.95% | $759.57 |
| 3 Month | +13.67% | $655.24 |
| 6 Month | +8.41% | $687.01 |
| YTD | +9.02% | $683.17 |
| 1 Year | +20.58% | $617.65 |
| ALL (5.0y) | +72.03% | $432.93 (CAGR +11.52%) |
Volatility & Risk Metrics
Computed over trailing ≈5.0 years of daily closes.
| Metric | Value |
|---|---|
| Annualized return (CAGR) | 11.52% |
| Annualized volatility | 17.19% |
| Downside deviation | 17.83% |
| Sharpe ratio | 0.41 |
| Sortino ratio | 0.39 |
| Max drawdown | -25.36% (bottomed 2022-10-12) |
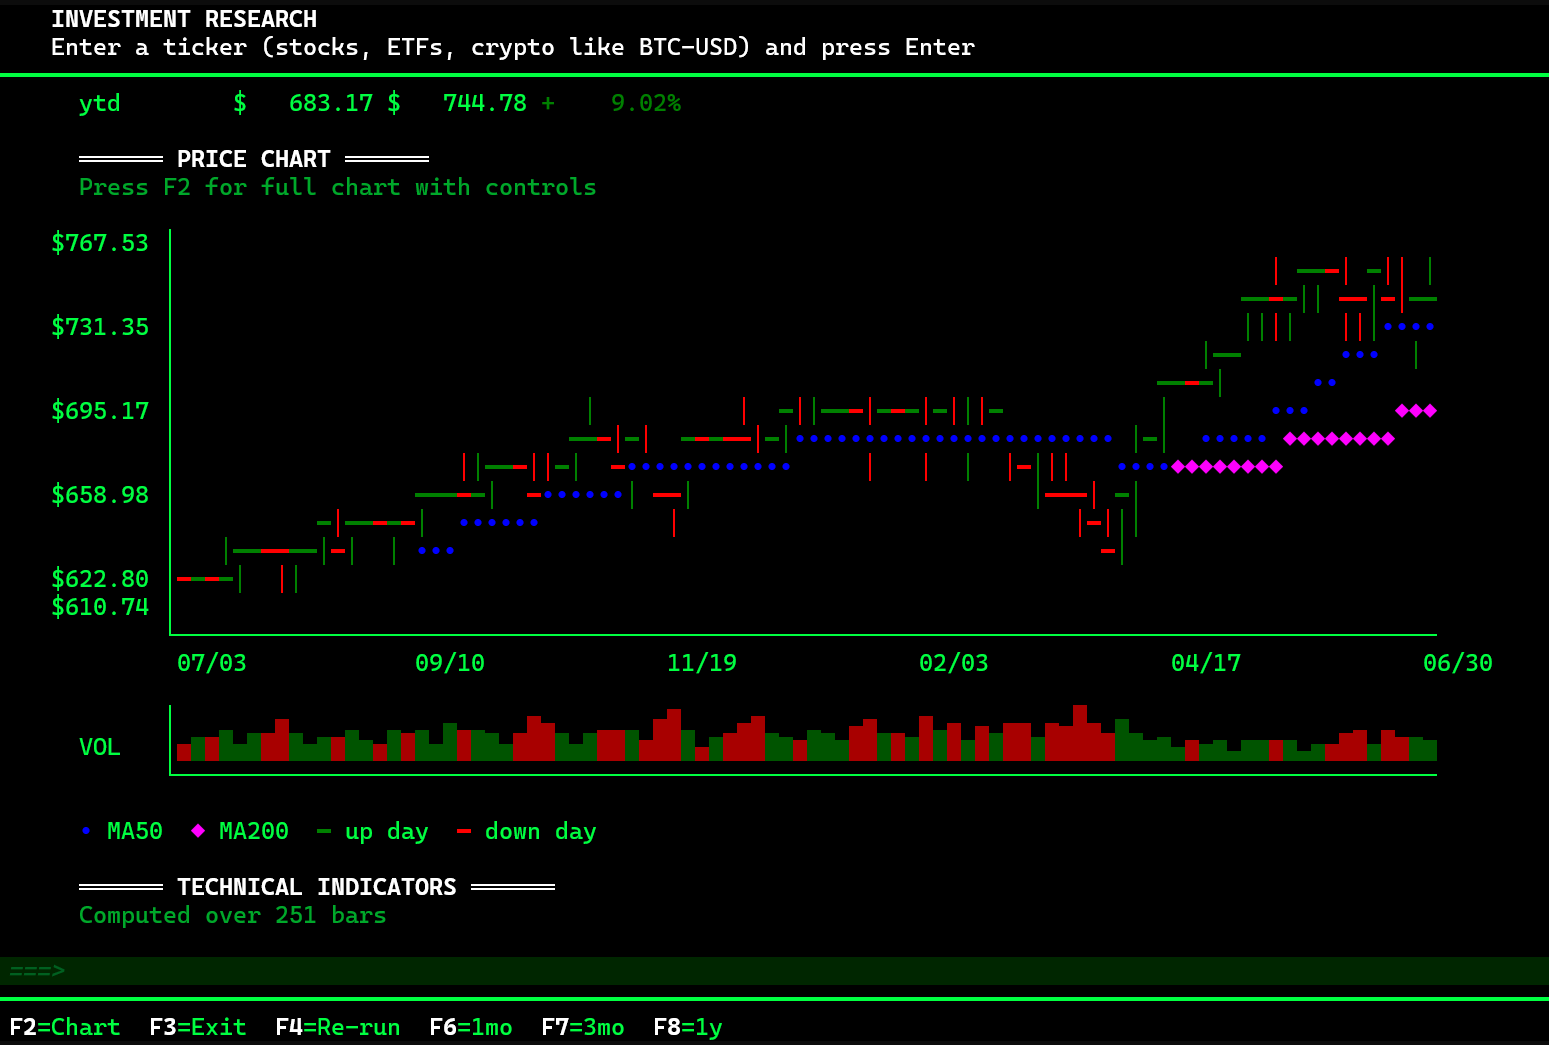
Price Chart — 1 Year
$ 754.83 |                                                      ** *
         |                                                   ***  * *
         |                                                   |       *
         |                                                 **
         |                                               **
         |                           * * ** ***  *       |
$ 687.64 |                    ***  ** ||*  *   ** **    *
         |               ** **   * |  *             *   |
         |            ***  *      *                  | *
         |       *****                               **
         |   ** *
$ 620.45 |***  *
         +------------------------------------------------------------
          2025-07-02               2025-12-31               2026-06-26
Price Chart — 30 Days
$ 759.57 |       **
         |     **  **      *
         |   **      |     |*
         | **        |     | |**     ***
$ 742.50 |*          |*  **  *  |   *
         |           * * |      *** |
         |              ||         *
$ 725.43 |              *
         +------------------------------
          2026-05-20 2026-06-11 2026-07-02
Technical Analysis
Composite Signal: 🟢 BULLISH (Moderate)
Score: +0.20 on a scale of -1 (fully bearish) to +1 (fully bullish).
- Bullish signals: 3
- Bearish signals: 2
- Neutral signals: 6
Individual Indicators
| Indicator | Signal | Interpretation |
|---|---|---|
| RSI-14 | 🟡 NEUTRAL | RSI 53 in neutral zone |
| MACD | 🔴 BEARISH | MACD Bearish (above zero) |
| MA-50 | 🟢 BULLISH | Price above MA50 ($737.43) |
| MA-200 | 🟢 BULLISH | Price above MA200 ($692.29) |
| MA-50/200 cross | 🟢 BULLISH | Golden Cross (MA50 > MA200) |
| Bollinger Bands | 🟡 NEUTRAL | Mid-band (pos 62%) |
| Volume | 🟡 NEUTRAL | Volume normal (1.03× avg) |
| ADX | 🟡 NEUTRAL | ADX 19 (weak trend, ranging) |
| Stochastic | 🟡 NEUTRAL | Stochastic 70 |
| OBV | 🔴 BEARISH | OBV falling (distribution) |
| ATR | 🟡 NEUTRAL | ATR $10.16 (1.4%) — normal |
Trading Thesis
Short-Term Outlook (0–3 months): 🔴 AVOID (Moderate)
Short-term momentum is soft. New long positions carry elevated risk of immediate drawdown. Wait for a clearer reversal signal (e.g. RSI < 30 or bullish MACD cross).
Supporting factors:
- RSI is 53.5 — neutral zone, no immediate directional signal.
- MACD is bearish — MACD Bearish (above zero).
Long-Term Outlook (12+ months): 🟢 BUY (Moderate)
Long-term structure leans bullish. Most trend indicators are constructive, though not every signal confirms. A staged accumulation plan is reasonable.
Supporting factors:
- Price is above the 50-day moving average — Price above MA50 ($737.43).
- Price is above the 200-day moving average — Price above MA200 ($692.29).
- MA-50 is above MA-200 (Golden Cross) — durable long-term uptrend structure.
- ADX at 19 indicates a weak trend — market is range-bound.
- On-Balance Volume trend is down — distribution pressure.
- Trading at 89% of the 52-week range — extended toward highs.
Data & Methodology
- Price data: Yahoo Finance’s unofficial public API. Historical closes are dividend-adjusted.
- Sharpe / Sortino: computed against a 4.5% risk-free rate (approximate trailing 3-month T-bill).
- Signal composite: unweighted tally of individual indicator verdicts, mapped to a score in [-1, +1].
- Thesis narratives: rule-based interpretation of indicator readings — not machine-learned.
- Bar count: full available history from the data source (may be less than 5 years for newer symbols).
Disclaimer: This report is algorithmic analysis for informational and educational purposes. It is not investment advice or a solicitation to buy or sell any security. Do your own research; consult a licensed financial advisor before making investment decisions.
Generated by FIN/400 on 2026-07-05 15:31 UTC.
Leave a Reply