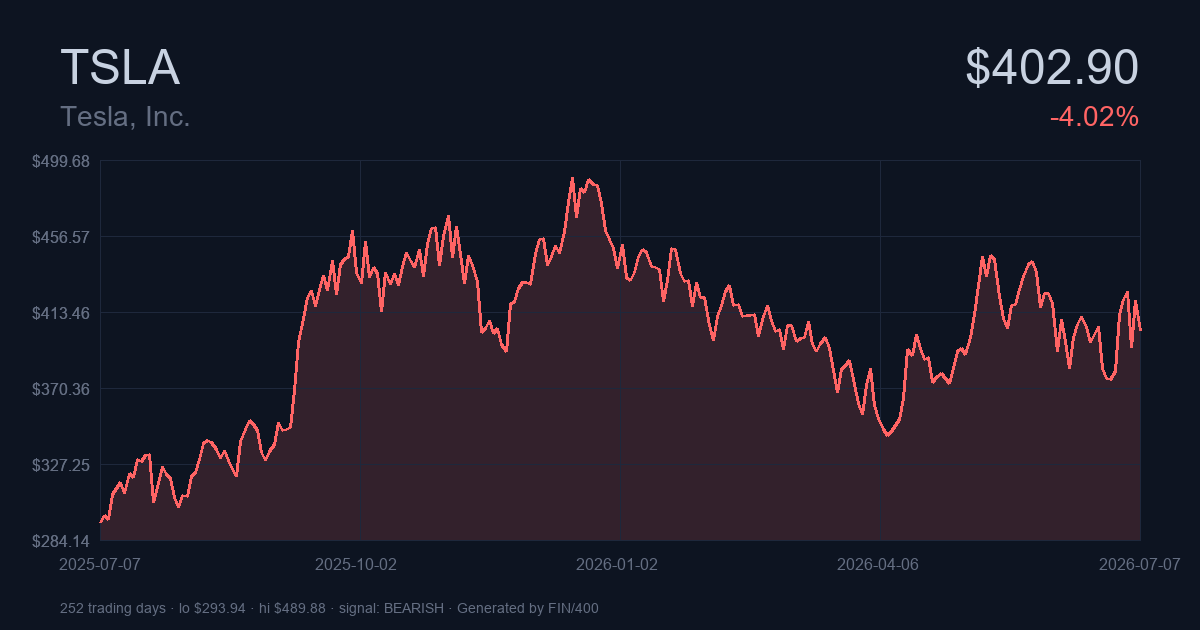
Deep-dive research on Tesla, Inc. (TSLA) — published 2026-07-07 18:28 UTC, current price $402.90.
TSLA closed at $402.90 today. Over the trailing 12 months the return has been +27.8%, and the composite of 11 technical indicators currently reads as bearish. The rest of this analysis unpacks what that composite is built from, which readings matter most right now, and what actionable conclusions a trader or investor can draw from the picture. One risk-management note up front: annualized volatility for TSLA is running at 59.1%, well above broad-market norms. Position sizing should reflect that, regardless of which side of the trade this analysis favors.
The Short Version
Our take on TSLA as of July 07, 2026, drawn from the full indicator suite plus historical risk metrics:
- Near-term view (0-3mo): BUY — moderate conviction
- Multi-year view (12mo+): AVOID — strong conviction
- Composite reading: Bearish — moderate strength
TSLA closed at $402.90 (-4.02% ▼ on the day), placing it 53% through its 52-week range of $293.55 to $498.83. Details in the sections below.
Key Takeaways
If you only read one section, read this — the highlights of what TSLA’s data says:
- Trailing 1-year: TSLA has gained 27.76%, outpacing the long-run US equity average of roughly +10%.
- Volatility: 59.14% annualized is elevated. Sharpe 0.15, Sortino 0.14.
- Historical drawdown: worst peak-to-trough in the sample was -73.63%, bottomed on 2023-01-03.
- Technical composite: score -0.20 on -1/+1 scale — 2 bullish indicators vs 3 bearish.
- Verdicts: short-term BUY (moderate conviction), long-term AVOID (strong conviction).
About TSLA
TSLA — full name Tesla, Inc. — is an equity listed on NMS, denominated in USD. The read that follows works from Yahoo Finance’s public daily close series.
At-a-Glance Data
| Attribute | Value |
|---|---|
| Symbol | TSLA |
| Full name | Tesla, Inc. |
| Exchange | NMS |
| Currency | USD |
| Type | equity |
| 52-week high | $498.83 |
| 52-week low | $293.55 |
| Position in 52w range | 53% |
Recent Price Action and Performance
The trailing-year picture for TSLA is unusually strong: +27.76%, a return well outside the normal-year band for equities. Recent momentum has been strong — the past three months alone contributed +14.19% to the trailing-year total, suggesting current buyers are still finding conviction at these price levels. Year-to-date, TSLA is -8.03%, giving investors a real-time gauge of how the current calendar year has treated the position.
Trailing Returns Table
Here are TSLA’s returns over the windows people usually care about. Yahoo’s adjusted closes include reinvested dividends, so these are effectively total-return figures.
| Time window | Total return | Starting price |
|---|---|---|
| 1 Day | -4.02% | $419.77 |
| 1 Week | -2.17% | $411.84 |
| 1 Month | -3.72% | $418.45 |
| 3 Month | +14.19% | $352.82 |
| 6 Month | -8.03% | $438.07 |
| Year-to-Date | -8.03% | $438.07 |
| 1 Year | +27.76% | $315.35 |
| Full sample (5.0y) | +85.15% (CAGR +13.18%) | $217.60 |
Risk and Volatility Analysis
Volatility on TSLA is 59.14% annualized — a high-vol ticker. Position sizing needs to reflect that even correct trades will pass through uncomfortable mark-to-market moves. The Sharpe ratio of 0.15 is marginal — returns barely justify the volatility taken; a buy-and-hold Treasury allocation would have delivered comparable outcomes with far less anxiety. Sortino: 0.14. The max drawdown of -73.63% (bottom: 2023-01-03) is the honest worst-case in the record. Any position sized without room to weather a repeat is over-sized.
Risk metrics computed over trailing ~5.0 years of daily closes.
| Risk metric | Value | What it measures |
|---|---|---|
| Annualized return (CAGR) | 13.18% | Compound growth rate — geometric mean annualized |
| Annualized volatility | 59.14% | Standard deviation of returns, scaled to one year |
| Downside deviation | 60.11% | Volatility of negative returns only |
| Sharpe ratio | 0.15 | Excess return per unit of total volatility (vs 4.5% Rf) |
| Sortino ratio | 0.14 | Excess return per unit of downside volatility |
| Max drawdown | -73.63% | Largest peak-to-trough decline (bottomed 2023-01-03) |
TSLA, One-Year View
$ 481.20 |                           ***
         |                    *      |  |
         |              *   ** |   **   ** *
         |            ** ***   *   |      * * *              * **
         |            |         | *          * *             |*  |   *
         |            |         **              *****    *  *    *** |
$ 387.57 |            |                              *   |**        *
         |            |                               *  |
         |      *  ***                                 **
         |   ** |**
         | **  *
$ 293.94 |*
         +------------------------------------------------------------
          2025-07-07               2026-01-05               2026-06-30
The chart above traces the price journey from $293.94 on 2025-07-07 to $402.90 on 2026-07-07, a net change of +37.07% over roughly 1 year(s) of trading.
The Last 30 Days
$ 442.10 |  **
         | *  *
         |*    |***                ** *
         |     *   |*    *        *  |||
$ 408.61 |         ||| ** * **    |  ||*
         |         * * |   *  |   |  *
         |            *       *   |
$ 375.12 |                     ***
         +------------------------------
          2026-05-22 2026-06-15 2026-07-07
Zooming into the last 30 sessions lets you see the shorter-term structure clearly: recent support and resistance levels, breakout points, and near-term momentum shifts.
The Actionable Read on TSLA
Two verdicts, two horizons. A short-term read (weeks-to-months) that watches oscillators, and a longer-term read (a year plus) that watches structural trend indicators.
Short-Term Outlook (Next 3 Months): 🟢 BUY (Moderate Conviction)
Short-term signals lean positive but not unanimously. A partial position or wait-for-confirmation stance is reasonable. Watch for a break above recent resistance.
Key factors supporting this buy view:
- RSI reads 49.6, mid-range. TSLA’s momentum signal is neutral; look elsewhere for the actionable read.
- MACD: BULLISH — MACD Bullish (still negative). The trend-follower’s crossover signal for TSLA, tracking whether short-term momentum is accelerating or decelerating relative to the intermediate trend.
Long Horizon (12mo+): 🔴 AVOID — Strong
Long-term structure is bearish. Trend, momentum, and volume flows are aligned to the downside. No case for a core position — capital better allocated elsewhere.
The specific readings behind the avoid call:
- Price is below the 50-day moving average — Price below MA50 ($407.65).
- Price is below the 200-day moving average — Price below MA200 ($418.48).
- 50-day MA read: BEARISH — Price below MA50 ($407.65). For TSLA, this is the dividing line between an intact medium-term trend and one that has just cracked.
- ADX reading: NEUTRAL — ADX 14 (weak trend, ranging). Trend strength — not direction. Above 25 = trending market where momentum strategies work; below 20 = chop where mean-reversion works.
- Volume signal: NEUTRAL — Volume normal (1.01× avg). Volume-price confirmation — rising prices need rising participation to be sustainable; the opposite pattern usually precedes reversals.
Signal-by-Signal Breakdown
Technical analysis reads patterns in price and volume to infer the balance of supply and demand — the collective actions of buyers and sellers. No single indicator is decisive; each captures a different facet of market behavior. Value comes from combining them and looking for agreement across independent signals.
The Aggregate: 🔴 Bearish — Moderate
Rolling up the 11 individual indicators into one number: 2 vote bullish, 3 vote bearish, 6 vote neutral. That produces a net score of -0.20 on the -1 to +1 scale (where -1 means every indicator screaming bear and +1 means every one screaming bull).
Verdict: Moderate bearish. When multiple indicator families agree on downside, catching the bottom prematurely is a common way to get hurt — trend confirmation before adding is worth waiting for.
Signal Breakdown by Indicator
Below is each indicator’s current signal. Where a reading is close to neutral, no additional commentary is needed — the number speaks for itself. Where a reading is unusual, the interpretation follows.
| Indicator | Signal | Interpretation |
|---|---|---|
| RSI-14 | 🟡 NEUTRAL | RSI 50 in neutral zone |
| MACD | 🟢 BULLISH | MACD Bullish (still negative) |
| MA-50 | 🔴 BEARISH | Price below MA50 ($407.65) |
| MA-200 | 🔴 BEARISH | Price below MA200 ($418.48) |
| MA-50/200 cross | 🔴 BEARISH | Death Cross (MA50 < MA200) |
| Bollinger Bands | 🟡 NEUTRAL | Mid-band (pos 55%) |
| Volume | 🟡 NEUTRAL | Volume normal (1.01× avg) |
| ADX | 🟡 NEUTRAL | ADX 14 (weak trend, ranging) |
| Stochastic | 🟡 NEUTRAL | Stochastic 53 |
| OBV | 🟢 BULLISH | OBV rising (accumulation) |
| ATR | 🟡 NEUTRAL | ATR $20.15 (5.0%) — high volatility |
What the Extreme Signals Are Telling Us
Most indicators for TSLA sit in neutral territory right now — no strong signal, no education needed. The ones below are the exceptions. Each is producing a reading unusual enough to deserve a specific interpretation.
MACD
MACD: BULLISH — MACD Bullish (still negative). The trend-follower’s crossover signal for TSLA, tracking whether short-term momentum is accelerating or decelerating relative to the intermediate trend.
MA-50
50-day MA read: BEARISH — Price below MA50 ($407.65). For TSLA, this is the dividing line between an intact medium-term trend and one that has just cracked.
MA-200
200-day MA read: BEARISH — Price below MA200 ($418.48). Long-term trend proxy; more meaningful than the 50-day for allocators who don’t trade weekly.
MA-50/200 cross
Cross indicator: BEARISH — Death Cross (MA50 < MA200). Slow but consequential. A recent cross deserves more attention than one that’s been settled for months.
OBV
On-Balance Volume: BULLISH — OBV rising (accumulation). When OBV disagrees with price, price usually catches up eventually.
About the Numbers Above
How this analysis is built: daily closes from Yahoo Finance’s chart endpoint (dividend-adjusted), returns computed geometrically, volatility annualized with the standard sqrt-252 convention. The composite reading is a flat unweighted tally of individual indicator verdicts — no black-box weighting.
Important Disclosure
Consider this a technical opinion, not a recommendation. The author may or may not hold positions in the securities analyzed. All investment decisions require your own judgment about your personal risk tolerance and financial situation — please consult a qualified advisor before acting.
Report generated by FIN/400 on 2026-07-07 18:28 UTC. Data via Yahoo Finance. Snapshot as of the generation timestamp; markets move continuously.
Leave a Reply