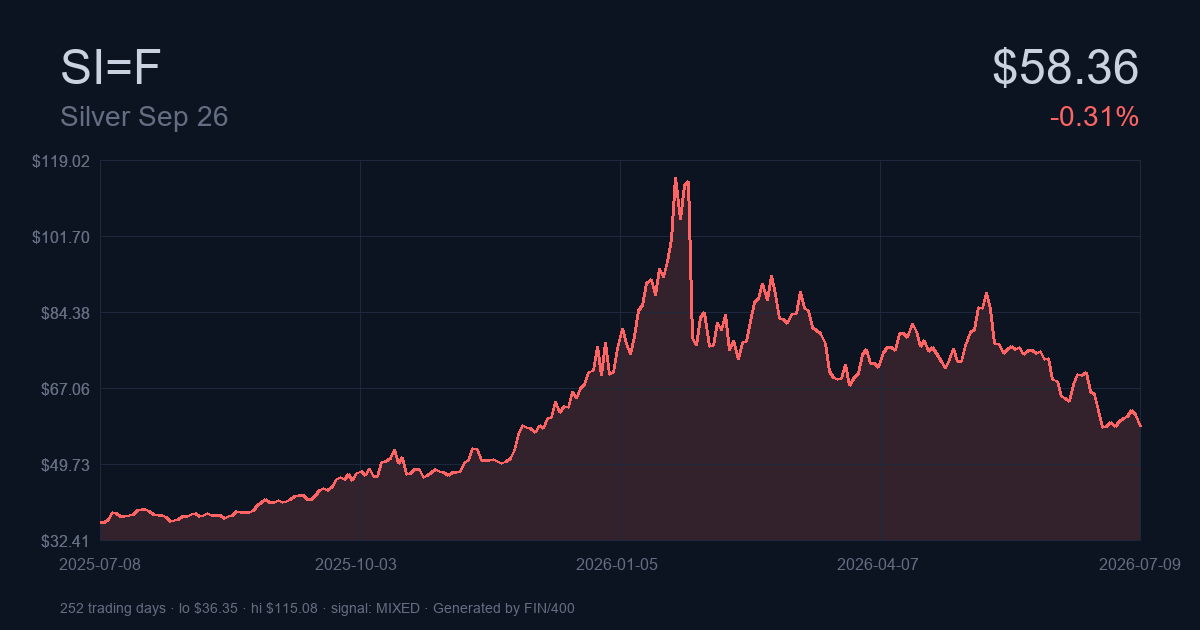
Technical analysis of Silver Futures (SI=F) — front-month continuous contract, published 2026-07-08 20:34 UTC, current price $58.36.
SI is trading at $58.36, but the story is the pace: SI has lost 18.7% in just the last three months alone, a move large enough that mean-reversion becomes a genuine tactical consideration alongside trend-following logic. One risk-management note up front: annualized volatility for SI is running at 40.1%, well above broad-market norms. Position sizing should reflect that, regardless of which side of the trade this analysis favors.
Bottom Line
The read on SI=F at today’s close, pulled together from every angle we look at:
- Short-term (0-3 months): BUY — moderate conviction
- Long-term (12+ months): HOLD — weak conviction
- Composite technical signal: Mixed — weak strength
SI=F closed at $58.36 (-0.31% ▼ on the day), placing it 26% through its 52-week range of $36.27 to $121.30. Details in the sections below.
Fast Read
The five things that most matter for a decision on SI=F right now:
- Trailing 1-year: SI=F has gained 59.39%, outpacing the long-run US equity average of roughly +10%.
- Volatility: 40.09% annualized is elevated. Sharpe 0.33, Sortino 0.30.
- Historical drawdown: worst peak-to-trough in the sample was -49.56%, bottomed on 2026-06-24.
- Technical composite: score -0.14 on -1/+1 scale — 3 bullish indicators vs 4 bearish.
- Verdicts: short-term BUY (moderate conviction), long-term HOLD (weak conviction).
The Security in Context: SI=F
SI=F — Silver Futures — is the front-month metals contract listed on COMEX, quoted per troy ounces. The chart data below is the continuous roll-adjusted series, which is what Yahoo publishes and what most technical analysis systems use for futures.
Security Reference Data
| Attribute | Value |
|---|---|
| Symbol | SI=F |
| Full name | Silver Sep 26 |
| Exchange | CMX |
| Currency | USD |
| Type | future |
| 52-week high | $121.30 |
| 52-week low | $36.27 |
| Position in 52w range | 26% |
Technical Analysis Deep Dive
Technical readings aren’t fortune-telling — they’re a compressed summary of what supply and demand have already done. The following section reads each signal for SI=F and combines them into a composite view.
Composite Signal: 🟡 Mixed (Weak)
The composite signal aggregates 11 independent technical indicators — each casting a bullish, bearish, or neutral vote — into a single summary reading. In this analysis, 3 of 11 indicators are bullish, 4 are bearish, and 4 are neutral, yielding a net score of -0.14 on a scale from -1 (unanimously bearish) to +1 (unanimously bullish).
This is a Weak mixed verdict, meaning some indicators lean bullish and others bearish. Mixed readings often occur near inflection points — markets transitioning from an uptrend to consolidation, or from a correction to a recovery. They call for patience rather than conviction.
Signal Breakdown by Indicator
The following table summarizes the current reading of each individual indicator. Detailed interpretation follows for the readings that are unusual enough to warrant explanation.
| Indicator | Signal | Interpretation |
|---|---|---|
| RSI-14 | 🟡 NEUTRAL | RSI 34 in neutral zone |
| MACD | 🟢 BULLISH | MACD Bullish (still negative) |
| MA-50 | 🔴 BEARISH | Price below MA50 ($71.04) |
| MA-200 | 🔴 BEARISH | Price below MA200 ($68.89) |
| MA-50/200 cross | 🟢 BULLISH | Golden Cross (MA50 > MA200) |
| Bollinger Bands | 🟡 NEUTRAL | Mid-band (pos 22%) |
| Volume | 🔴 BEARISH | Volume surge +184% on downtrend |
| ADX | 🔴 BEARISH | ADX 38 (strong downtrend) |
| Stochastic | 🟢 BULLISH | Stochastic 10 (oversold) |
| OBV | 🟡 NEUTRAL | OBV trend mixed |
| ATR | 🟡 NEUTRAL | ATR $2.38 (4.1%) — high volatility |
What the Extreme Signals Are Telling Us
Skipping the neutral readings for space — here are only the SI=F indicators that are currently producing a directional signal worth thinking through.
RSI-14
RSI reads 34.1, lower half of neutral. SI=F has lost some momentum but hasn’t hit levels where oversold-bounce dynamics kick in.
MACD
MACD reading: BULLISH — MACD Bullish (still negative). A trend-confirmation indicator; useful mainly when it agrees with price action rather than trying to lead it.
MA-50
Price vs MA-50: BEARISH — Price below MA50 ($71.04). The 50-day is the standard medium-term trend line; where SI=F’s close sits relative to it says a lot in one number.
MA-200
Price vs MA-200: BEARISH — Price below MA200 ($68.89). The most-watched long-term trend indicator; institutional trend-followers use it as an on/off exposure switch.
MA-50/200 cross
MA-50/200 cross: BULLISH — Golden Cross (MA50 > MA200). Golden crosses and death crosses have poor short-term reliability but decent multi-month reliability. Where SI=F sits on this metric shapes multi-month positioning.
Volume
Volume read: BEARISH — Volume surge +184% on downtrend. Directional moves without volume behind them tend to fail; whether volume is expanding here matters for the persistence of the current move.
ADX
ADX status for SI=F: BEARISH — ADX 38 (strong downtrend). Tells you how to trade the ticker (trend-following vs mean-reversion), not which side to take.
Stochastic
Stoch reading for SI=F: BULLISH — Stochastic 10 (oversold). Short-term extreme detector; triggers earlier than RSI but has more false signals.
SI=F’s Recent Performance
SI=F has been a standout, returning +59.39% over the past year — roughly double the long-run US equity average. The complication: SI=F’s last three months are -18.75%, giving back part of the trailing-year gain. Either a pullback in an uptrend or the start of a topping process. Year-to-date, SI=F is -17.29%, giving investors a real-time gauge of how the current calendar year has treated the position.
SI=F’s Returns by Window
Here are SI=F’s returns over the windows people usually care about. Yahoo’s adjusted closes include reinvested dividends, so these are effectively total-return figures.
| Time window | Total return | Starting price |
|---|---|---|
| 1 Day | -4.22% | $60.93 |
| 1 Week | -1.88% | $59.48 |
| 1 Month | -15.35% | $68.94 |
| 3 Month | -18.75% | $71.83 |
| 6 Month | -23.38% | $76.16 |
| Year-to-Date | -17.29% | $70.56 |
| 1 Year | +59.39% | $36.62 |
| Full sample (5.0y) | +124.75% (CAGR +17.63%) | $25.97 |
Risk-Metric Deep Dive
40.09% annualized volatility for SI=F is elevated enough that position sizing dominates other considerations — this is not a set-and-forget name. Sharpe of 0.33 is weak. On a risk-adjusted basis, SI=F hasn’t delivered enough excess return to compensate for the volatility endured. Sortino 0.30. The max drawdown of -49.56% (bottom: 2026-06-24) is the honest worst-case in the record. Any position sized without room to weather a repeat is over-sized.
Risk metrics computed over trailing ~5.0 years of daily closes.
| Risk metric | Value | What it measures |
|---|---|---|
| Annualized return (CAGR) | 17.63% | Compound growth rate — geometric mean annualized |
| Annualized volatility | 40.09% | Standard deviation of returns, scaled to one year |
| Downside deviation | 43.79% | Volatility of negative returns only |
| Sharpe ratio | 0.33 | Excess return per unit of total volatility (vs 4.5% Rf) |
| Sortino ratio | 0.30 | Excess return per unit of downside volatility |
| Max drawdown | -49.56% | Largest peak-to-trough decline (bottomed 2026-06-24) |
The Trailing-Year Chart
$ 114.04 |                                  *
         |                                  ||
         |                                 * |
         |                                 | |
         |                               **  |* ***          *
         |                              *    * *   *    *** * |*
$  75.25 |                             *            ****   *  * **
         |                           **                           **
         |                         **                               **
         |               * ********
         |          ***** *
$  36.47 |**********
         +------------------------------------------------------------
          2025-07-08               2026-01-06               2026-07-01
Reading the chart: start at $36.47 on 2025-07-08, end at $58.36 on 2026-07-09. That’s +60.01% net across 1 year of daily bars.
The Last 30 Days
$  76.31 |* ****
         | *    **
         |        |     ***
         |        **   *   |
$  67.18 |          ** |   **
         |            *      *
         |                    |   *****
$  58.05 |                    ****     *
         +------------------------------
          2026-05-26 2026-06-16 2026-07-09
Zooming into the last 30 sessions lets you see the shorter-term structure clearly: recent support and resistance levels, breakout points, and near-term momentum shifts.
The Actionable Read on SI=F
The following thesis distinguishes between two independent time horizons: short-term (0-3 months) and long-term (12+ months). These horizons draw on different subsets of the indicators above.
The 3-Month View: 🟢 BUY (Moderate)
Short-term signals lean positive but not unanimously. A partial position or wait-for-confirmation stance is reasonable. Watch for a break above recent resistance.
Key factors supporting this buy view:
- RSI reads 34.1, lower half of neutral. SI=F has lost some momentum but hasn’t hit levels where oversold-bounce dynamics kick in.
- MACD reading: BULLISH — MACD Bullish (still negative). A trend-confirmation indicator; useful mainly when it agrees with price action rather than trying to lead it.
- Stoch reading for SI=F: BULLISH — Stochastic 10 (oversold). Short-term extreme detector; triggers earlier than RSI but has more false signals.
- Volume read: BEARISH — Volume surge +184% on downtrend. Directional moves without volume behind them tend to fail; whether volume is expanding here matters for the persistence of the current move.
Long-Term Outlook (12+ Months): 🟡 HOLD (Weak Conviction)
Long-term picture is inconclusive. Not decisively trending in either direction. Existing positions can be held; new core positions require clearer conviction.
What’s driving the hold take:
- Price is below the 50-day moving average — Price below MA50 ($71.04).
- Price is below the 200-day moving average — Price below MA200 ($68.89).
- Price vs MA-50: BEARISH — Price below MA50 ($71.04). The 50-day is the standard medium-term trend line; where SI=F’s close sits relative to it says a lot in one number.
- ADX status for SI=F: BEARISH — ADX 38 (strong downtrend). Tells you how to trade the ticker (trend-following vs mean-reversion), not which side to take.
- Trading at 26% of the 52-week range — near the low end, potential value zone.
About the Numbers Above
Methodology in brief: prices are Yahoo Finance’s adjusted-close series, returns are compound (not arithmetic mean), risk metrics use daily log-returns annualized, Sharpe assumes 4.5% risk-free rate. The composite verdict is a simple majority across 11 rules-based indicators, chosen for auditability over sophistication.
Before Acting on Any of This
This is algorithmic technical analysis for informational purposes only — not investment advice or a solicitation. Technical indicators produce false signals, particularly near market turning points. Do your own research; consult a licensed advisor before acting.
Report generated by FIN/400 on 2026-07-08 20:34 UTC. Data via Yahoo Finance. Snapshot as of the generation timestamp; markets move continuously.
Leave a Reply